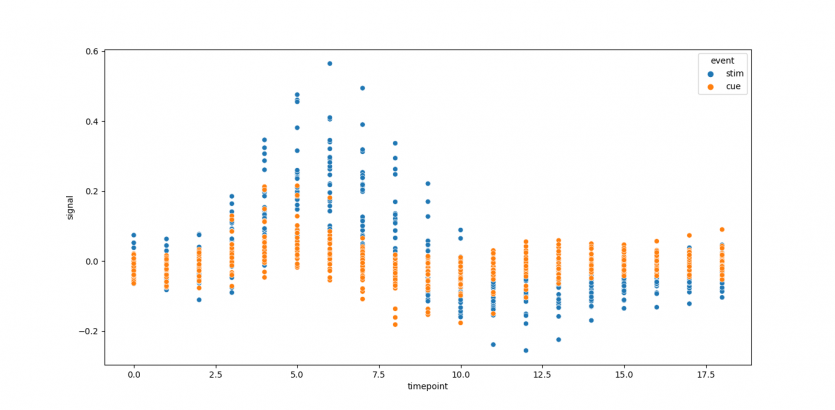
mri 데이터를 산점도 그래프(scatterplot)로 출력[exam12_graph2]
페이지 정보
작성자 관리자 댓글 0건 조회 280회 작성일 21-09-25 21:36본문
import pandas as pd
import matplotlib.pyplot as plt
import seaborn as sns

df = pd.read_excel("fmri.xlsx", sheet_name = "fmri")

#print(df)

#추정회귀에 사용된 데이터를 산점도로 표시해보기
#추정회귀데이터를 산점도 그래프로 표시(엑셀에서 timepoint 1이고 event는 cue인 데이터의 signal을 그래프 확대하여 검증 )
#그래프를 png이미지로 저장해보고 , 확대하여 검증해보기
#event, stimulate자극,cue신호?
sns.scatterplot(x=df['timepoint'], y=df['signal'], hue=df['event'], data=df)
plt.show()
댓글목록
등록된 댓글이 없습니다.


